
Parallels RAS Performance Monitor is a separate component of Parallels RAS with its own installer. It can be installed on a dedicated server or on a server hosting any of the Parallels RAS components.
When you run the installer, the InfluxDB database is automatically installed and Parallels RAS-specific Grafana dashboards are created. For additional information, see the Installation subsection below.
The following firewall rule (open port) is automatically added on the server where you install Parallels RAS Performance Monitor:
- TCP port 8086 (used by the InfluxDB database).
Prerequisites:
Grafana:
Parallels RAS Performance Monitor requires Grafana to visualize collected Parallels Remote Application Server performance metrics. Grafana is installed and updated separately from Performance Monitor.
This approach allows customers to manage and update Grafana independently of the Parallels RAS release cadence, and to stay current with supported Grafana versions and editions while aligning with Grafana licensing requirements.
Before installing Performance Monitor, Grafana must be installed on the same server where Performance Monitor will be deployed.
- Manual configuration of a database connection is not required, as this is automatically configured during the Performance Monitor installation.
- It is recommended to run Grafana as a service.
- Both Grafana Enterprise and Grafana OSS editions are supported.
- Supported Grafana versions: 11.x to 13.x (inclusive).
Grafana can be downloaded from the official website
Installing Parallels RAS Performance Monitor:
To install Parallels RAS Performance Monitor:
-
Download the Parallels RAS Performance Monitor installer from Download Links .
-
Run the installation wizard (the RASPerformanceMonitor.msi file) and follow the onscreen instructions.
-
Close the wizard when finished.
Configure access to Parallels RAS Performance Monitor To enable data collection and view the dashboard:
1. In the RAS Console, navigate to Administration > Reporting.
2. Select the Enable RAS Performance Monitor option (the RAS Performance Monitor configuration section).
3. Enter the FQDN or IP address of the server where you have the InfluxDB database and Grafana dashboard installed.
4. Click Apply to commit the changes.
Once you perform the steps above, the Telegraf service is started on each server in the Site, and the data collection begins.
Viewing performance metrics:
To view performance metrics, select the Monitoring category in the RAS Console. The data is displayed in the right pane. The logon is performed automatically, so no logon credentials are required.

The buttons on the Monitoring tab (below the dashboard area) are as follows:
-
Home. Displays the home page. The button is useful when you click on an external link in the dashboard, which may take you to an external web page.
-
Refresh. Reloads the current page.
-
Open in browser. Opens the performance dashboard in a web browser.
To view metrics of a specific type, expand the desired category in the dashboard's main area. The categories include:
-
Session Information. Displays the information about active sessions and disconnected sessions. Note: AVD and VDI sessions are not shown here.
-
CPU usage. CPU counters.
-
Free memory. Physical memory counters.
-
Disk usage. Disk I/O counters.
-
Network usage. Network interface I/O counters.
-
System information. System information counters.
-
RAS Gateway information. RAS Gateway counters.
Performance metrics are displayed in the dashboard as a graph. Different counters are displayed using different colors.
To zoom in on a particular area of a graph, select a rectangular block with a mouse. You can also use the Zoom controls at the top of the dashboard for time range zoom out, shift time forward, or shift time backward. To select a specific time range, click the "clock" icon at the top and then specify a time range.
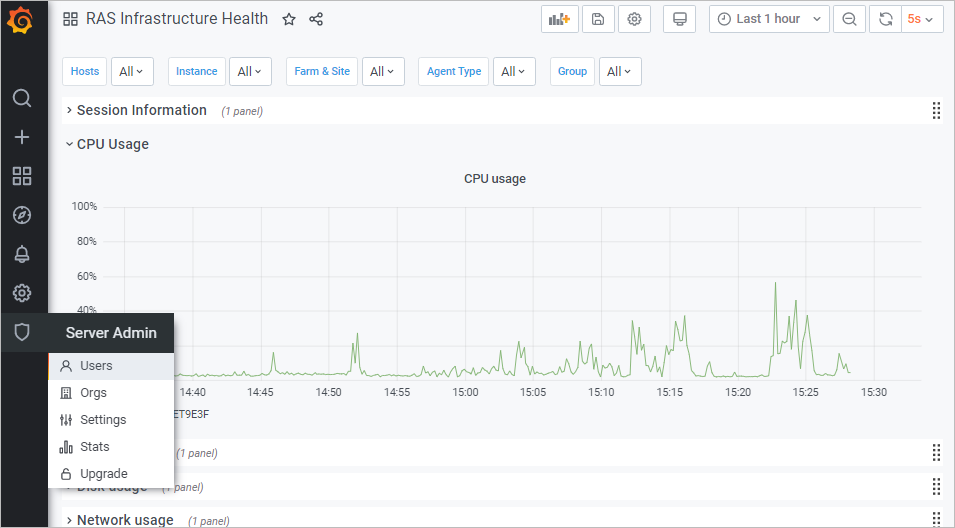
By default, the dashboard opens in kiosk mode. To exit it, press Esc. To cycle view mode, click the "monitor" icon in the upper right. When you exit the kiosk mode, the RAS Infrastructure Health page is displayed:

The menu at the top has the following items:
-
Hosts. Allows you to select one or multiple servers for which the performance metrics should be displayed. To display the data for all servers in the Site, select All. Please note that if you don't see any servers in the list, you need to wait for Parallels RAS Performance Monitor to collect the initial set of statistics. This only happens on initial installation.
-
Instance. This item allows you to select a specific counter instance (if there's more than one). For Network counters, it is usually the name of a network interface. For Disk counters, it is a disk name. Other types of counters don't usually have multiple instances.
-
Farm & Site. Select a Site for which to display the data. Selecting All displays the data for all sites in the Farm. If you have another RAS Farm, and the RAS Performance Monitor is configured and enabled in it, you can also select a Site from that Farm.
-
Agent Type. Select a RAS agent type.
-
Group. Select an RDS group.
Configure RAS Performance Monitor security:
By default, any user can access the Performance Monitor page and view performance metrics. To increase security, you can configure the RAS Performance Monitor to use credentials so that only authorized users can view it.
First, remove anonymous authentication from the Grafana configuration file as follows:
-
Open file C:\Program Files\Parallels\RAS Performance Monitor\conf\defaults.ini.
-
In the file, look for the following:
#################################### Anonymous Auth ######################[auth.anonymous]# enable anonymous accessenabled = true -
Change
"enabled = true"to"enabled = false". Note: The user will be prompted to change the admin password automatically after disabling the anonymous access. After that, the password can be changed following the Grafana official documentation here. -
Restart the Grafana service.
-
Select the Monitoring category and log in to Grafana using the following credentials:
-
User: admin
-
Password: admin (if you changed the password before, use the current password).
-
-
Once logged in, press "Esc" and then click the "shield" icon > Users.
-
Click New user and create a new user.

-
You now need to add the user to your organization's list. To do so, in the Users list, click Edit to edit the user and then set the organization and make the user a Viewer.
-
Click Add to add the user to your organization's list. The user can now view the RAS Performance Monitor statistics.
Updating RAS Performance Monitor:
Newer versions of Grafana may be incompatible with a browser installed in the OS. A modern Edge browser is supported and will be embedded automatically in the RAS Console. But if it's not so, we suggest using a redistributable browser that comes in a form of a plugin. Plugins are available as separate msi packaged and distributed the same way as all other Parallels RAS distributions.
To avoid potential issues, Parallels RAS monitors which versions of Grafana and browser are installed and informs the RAS administrator about it when necessary. In a situation like that, when you select the Monitoring category, you will not see a dashboard as usual. Instead, a message is displayed that an updated browser plugin must be installed. To install the plugin, follow the instructions below.
-
In the main menu (at the top), click Tools and choose Plugins.
-
In the Plugins dialog, locate the Browser Engine plugin. The State column should indicate that it is not installed.
-
Select the plugin and click one of the following buttons:
-
Install online — Downloads the plugin from the Internet and installs it. Click this button if you can access the Internet from your environment.
-
Install offline — In an offline environment, the admin can't get the list of plugins and instead uploads the plugin zip from a local file server. Only installed plugins are listed in the plugins table.
-
-
After the plugin is installed, you can go back to the Monitoring category and this time you will see the Grafana dashboard.
To update or remove a plugin (if necessary), use the same instructions as above, but select a plugin that is marked "installed" and then click Update online (or offline) or Uninstall. Please note that custom dashboards are now maintained after upgrades from Parallels RAS 18 to future versions.
Was this article helpful?
Tell us how we can improve it.