Information
Please follow the instruction below to install the Parallels Remote Application Server Performance monitor.
Parallels RAS Performance Monitor can be installed on a dedicated server or on a server hosting any of the Parallels RAS components.
Parallels RAS Performance Monitor consists of the following components:
- InfluxDB database — a database for storage of system performance data.
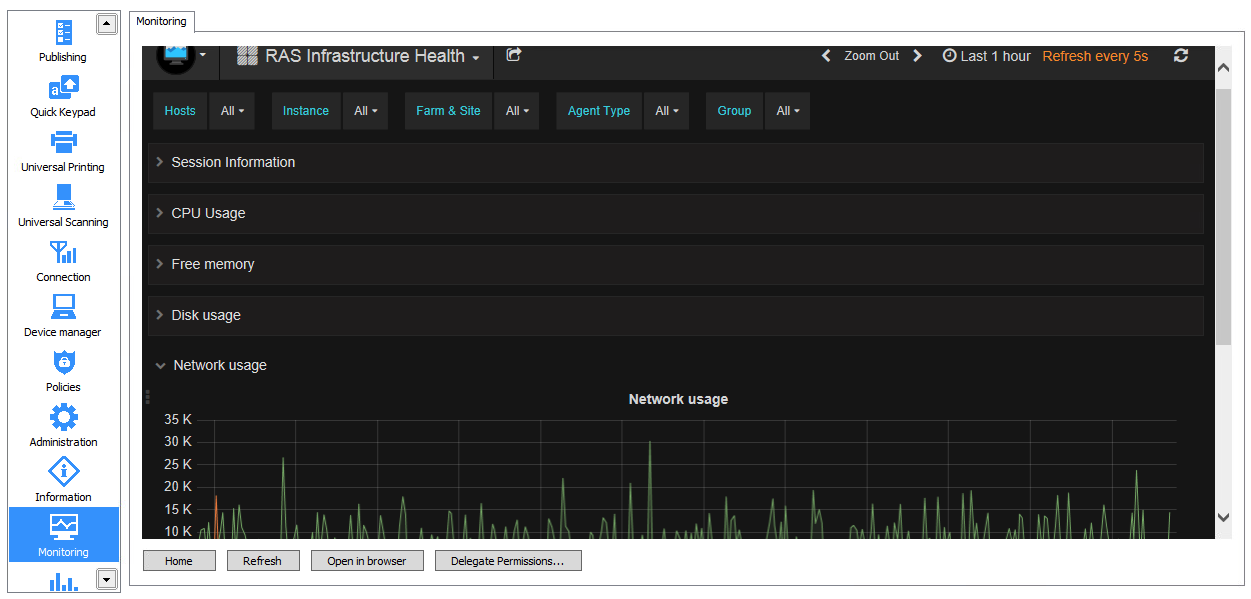
- Grafana dashboard — a browser-based dashboard providing a visual display of performance metrics.
- Telegraf service — a service that collects performance data on a server where it is installed. The service is installed automatically when you add a server to a Parallels RAS Farm and install a corresponding RAS Agent on it (e.g. RAS Secure Gateway Agent, RD Session Host Agent, Remote PC Agent, etc.).
Requirements:
Parallels RAS Performance Monitor is a separate component of Parallels RAS with its own installer. It can be installed on a dedicated server or on a server hosting any of the Parallels RAS components. When you run the installer, the InfluxDB database and the Grafana dashboard service are automatically installed.
The following firewall rules (open ports) are automatically added on the server where you install Parallels RAS Performance Monitor:
- TCP port 8086 (used by the InfluxDB database).
- TCP port 3000 (used by the Grafana performance dashboard).
Installing Parallels RAS Performance Monitor:
1. Download the Parallels RAS Performance Monitor installer from https://www.parallels.com/products/ras/download/links/
2. Run the installation wizard (the RASPerformanceMonitor.msi file) and follow the onscreen instructions.
3. Close the wizard when finished. The next step is to configure access to Parallels RAS Performance Monitor in the RAS Console.
Configuring access to Parallels RAS Performance Monitor
To enable data collection and view the dashboard:
1. In the RAS Console, navigate to Administration → Reporting.
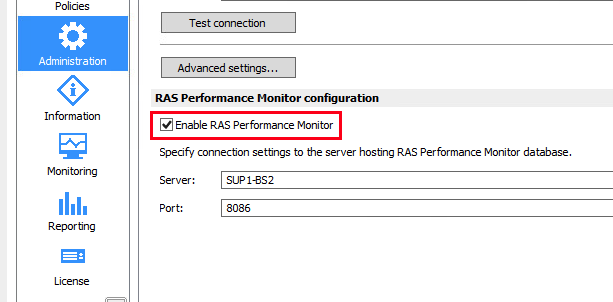
2. Select the Enable RAS Performance Monitor option (the RAS Performance Monitor configuration section).

3. Enter the FQDN or IP address of the server where you have installed the RAS Performance Monitor.
4. Click Apply to commit the changes.
Once you perform the steps above, the Telegraf service should be started on each server on the site and the data collection begins.

Was this article helpful?
Tell us how we can improve it.