UX Evaluator metric provides an indicative quantitative measure of the user experience, by calculating the time elapsed between the user interaction with the published resource and corresponding response. At the time of this writing, with the release of RAS v18, there are over 25 new session detail metrics available.
NOTE: Some metrics are available for RAS Sessions only.
Available metrics
Logon details
| Metric | Description |
| NEW Logon duration | Time taken to logon excluding the time waiting on UI |
| NEW Logon duration breakdown | 1.Connection time |
| 2.Authentication duration | |
| 3.Host preparation (inc. load balancing algorithm) | |
| 4.User profile load time | |
| 5.RAS Policies lookup | |
| 6.Group Policy processing | |
| 7.Desktop loading | |
| 8.Other | |
| NEW User Profile | User Profile method in use (FSLogix, User Profile Disk, Other) |
User Experience
| Metric | Description |
| NEW UX Evaluator | This is the time interval measured at the client between the first step (user action) and the last step (graphical response displayed). |
| NEW Connection quality | Connection quality rating (poor – excellent) |
| NEW Latency | Network latency |
| NEW Transport Protocol | TCP or UDP (over RDP) |
| NEW Bandwidth availability | Bandwitdh availability as seen from the client |
| NEW Reconnects | Number of reconnects the current session suffered from inception (excluding graceful ones) |
| NEW Last Reconnects | Number of reconnects suffered from the current device session (excluding graceful ones) |
| NEW Disconnect reason | The last session disconnect reason |
Session Details
| Metric | Description |
| Session State | Active, Idle, Disconnected, etc |
| Logon time | Time and date when the session was established |
| Session Length | Time the session has been established |
| Idle Time | Time the session has been idle |
| NEW Incoming Data | Amount of data received from the client |
| NEW Outgoing Data | Amount of data sent to the client |
| Resolution | Session resolution |
| Color Depth | Session colour depth |
| NEW Bandwidth Usage | Bandwidth used by the client |
Client Details
| Metric | Description |
| Device name | Name of the device from which the session was established |
| IP Address | Client private IP address |
| NEW Client OS | The operating system on which the client is running |
| NEW Client OS version | The operating system version on which the client is running |
| NEW Client version | The RAS client version is use |
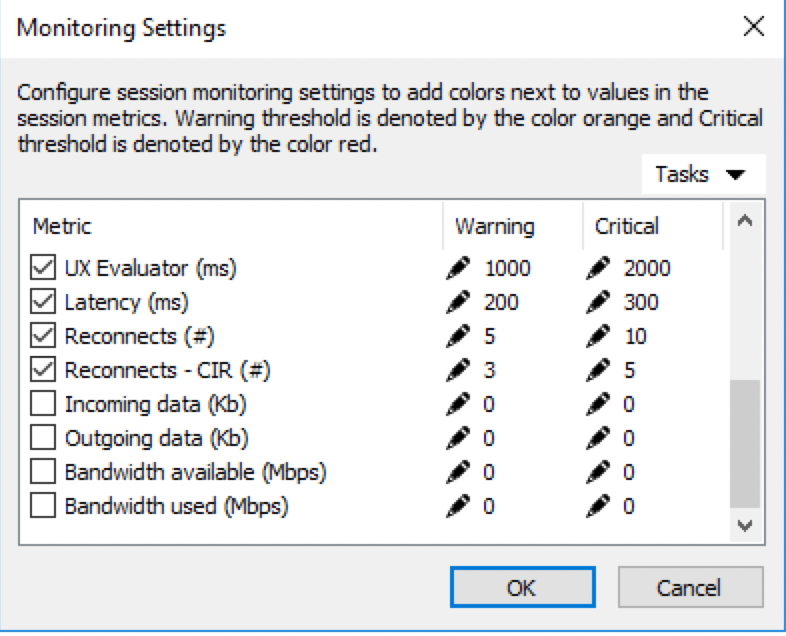
Monitoring Settings
Monitoring settings with customized thresholds may also be set to identify Warning and Critical levels for better aid to Administrators or helpdesk.
Viewing Session Details
In RAS Console switch to RD Session Hosts > Sessions tab.
There are some metrics available in the corresponding columns. Right-click on a column to select which metrics to display. You may click on More in this drop-down menu to open the dialogue and check/uncheck needful metrics.


Double-click on the session you need to view the detailed information in separate window:

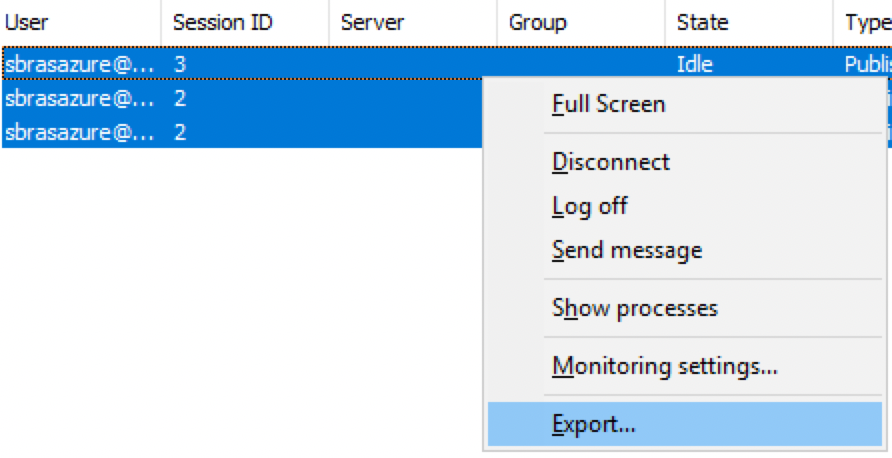
Exporting Sessions Details
Highlight needful sessions in the table right click on it and click on Export... to save the information in a csv file.
Was this article helpful?
Tell us how we can improve it.