Resolution
Note: This article currently focuses on the Developer Tools in Microsoft Edge and Google Chrome, as these are the primarily used browsers.
It's best to always start with a clean, preferably incognito / in-private browser session when reproducing an issue.
When the browser is launched, press [F12] before navigating.
The developer tools appear. It's a panel with some tabs (some may be hidden under an arrow that exposes a short navigation menu).
Console
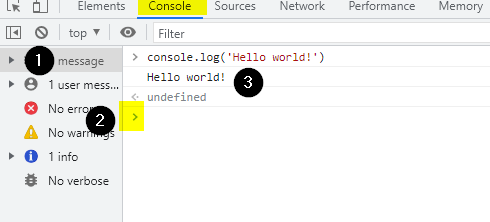
Click "Console". This tab contains a few elements:
- A clear button (1) to erase any previous output.
- A text field (2) to enter JavaScript instructions. Mind that this is often indicated by a small arrow with no text next to it yet. Click here to enter an instruction. Pressing [Enter] executes a command.
For example:
console.log('Hello world!') - Output (3) which displays the output of scripts running on the page, or the output of an instruction executed in the console (in the field from the step above).
Right-clicking in the output makes it possible to copy or save the console output.
An example from Google Chrome (other modern browsers have a similar interface:
Network
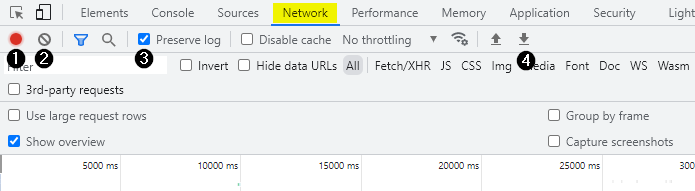
Click "Network". This will show an overview of all network requests.
It contains a few buttons:
- A record button (1), hovering indicates whether clicking will start or stop recording.
- A button to clear all prior logs (2), which may be recommended before reproducing the steps leading to the error.
- Mind that there is an option to make sure logs are kept even when navigating to another page. This option is often named "preserve logs" (3) or "persist logs". In most scenarios, it's best to enable this (unless asked otherwise).
- A button to export the network requests as a .HAR file. (4).
Below is an example of the Developer Tools in Google Chrome (in other modern browsers it looks similar):
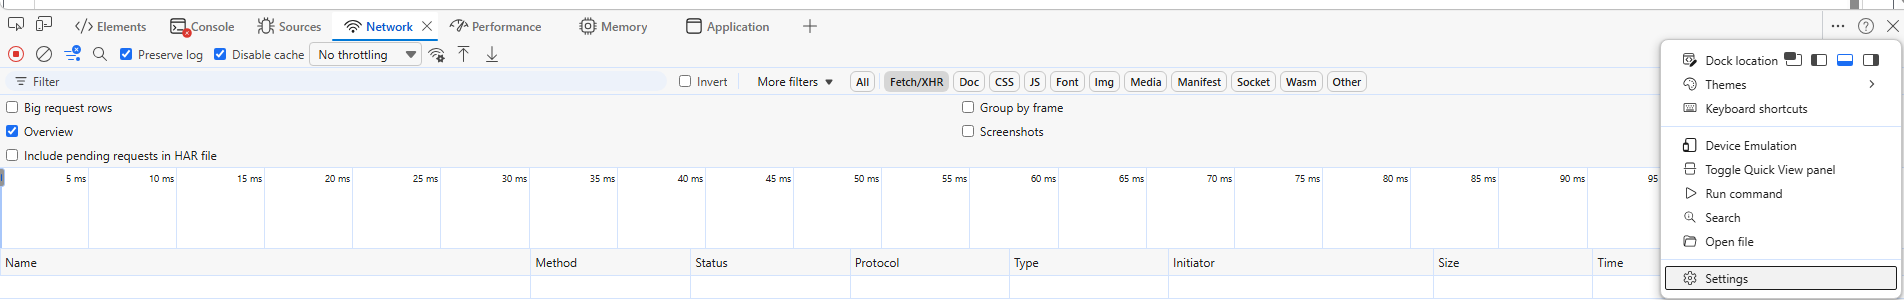
Other useful options can be found in the settings. The settings are locked under [...] > Settings:
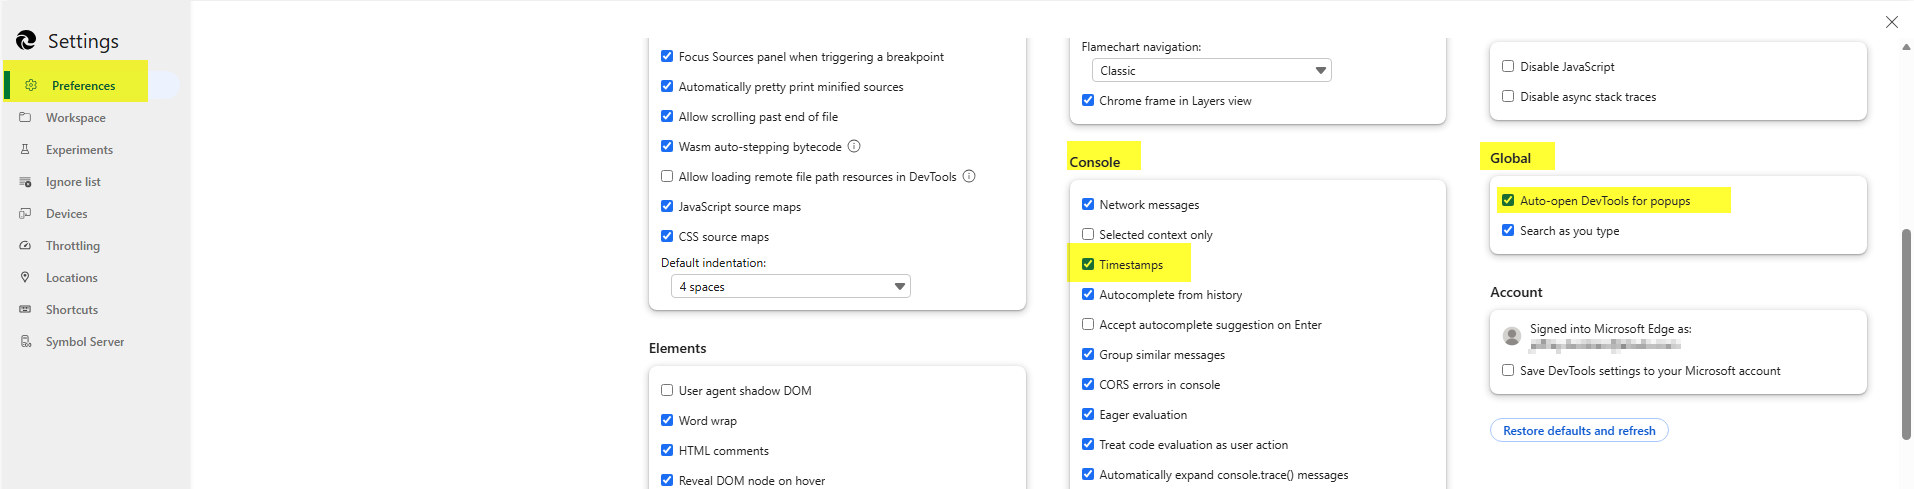
For example, under Preferences, these 2 settings can be very helpful:
- Global: Auto-open DevTools for popups.
- Console: Timestamps.
Was this article helpful?
Tell us how we can improve it.